最近jupyter notebookを使うことが多くなったが,notebookで作ったグラフをブログに載せるのが面倒で,いい方法はないかと探っていた.
こちらのブログにずばりな方法があったのでここでもやり方をメモしておく.
方法:
jupyter notebookを編集する- 編集したnotebookを以下のコマンドでmarkdown形式に変換する
jupyter nbconvert --to markdown jupyter-notebook-with-jekyll.ipynb jupyter-notebook-with-jekyll_files
(jupyter-notebook-with-jekyll_filesは画像の出力されるディレクトリ名.省略可.) - markdownファイルがカレントディレクトリに,グラフのpng画像が
jupyter-notebook-with-jekyll_filesのディレクトリの下にそれぞれ出力されるので,それを記事に貼り付ける
これでOK.出力されたmarkdownファイルを記事に貼り付ける場合は,画像を各自適切な場所へ配置してその場所へのパスに置換すること.

↑最初はこのようなパスになっているので,画像を再配置した場所へのパスに置換する.
上の方法で作成したjupyter notebookを貼り付けた結果がこちら:
import matplotlib.pyplot as plt
import pandas as pd
import seaborn as sns

sns.set(style='white', context='notebook', palette='deep')

%matplotlib inline
from sklearn import datasets
iris = datasets.load_iris()
iris_df = pd.DataFrame(iris.data, columns=iris.feature_names)
iris_df['target'] = pd.Series(iris.target)
iris_df.head()
<class 'sklearn.utils.Bunch'>
| sepal length (cm) | sepal width (cm) | petal length (cm) | petal width (cm) | target | |
|---|---|---|---|---|---|
| 0 | 5.1 | 3.5 | 1.4 | 0.2 | 0 |
| 1 | 4.9 | 3.0 | 1.4 | 0.2 | 0 |
| 2 | 4.7 | 3.2 | 1.3 | 0.2 | 0 |
| 3 | 4.6 | 3.1 | 1.5 | 0.2 | 0 |
| 4 | 5.0 | 3.6 | 1.4 | 0.2 | 0 |
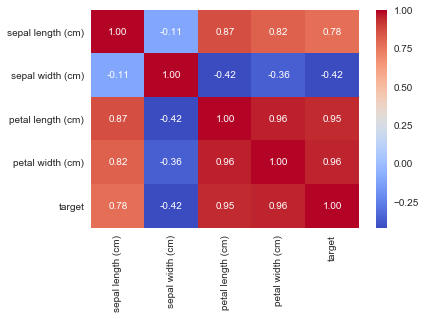
sns.heatmap(iris_df.corr(), annot=True, fmt='.2f', cmap='coolwarm')
<matplotlib.axes._subplots.AxesSubplot at 0x11043f978>